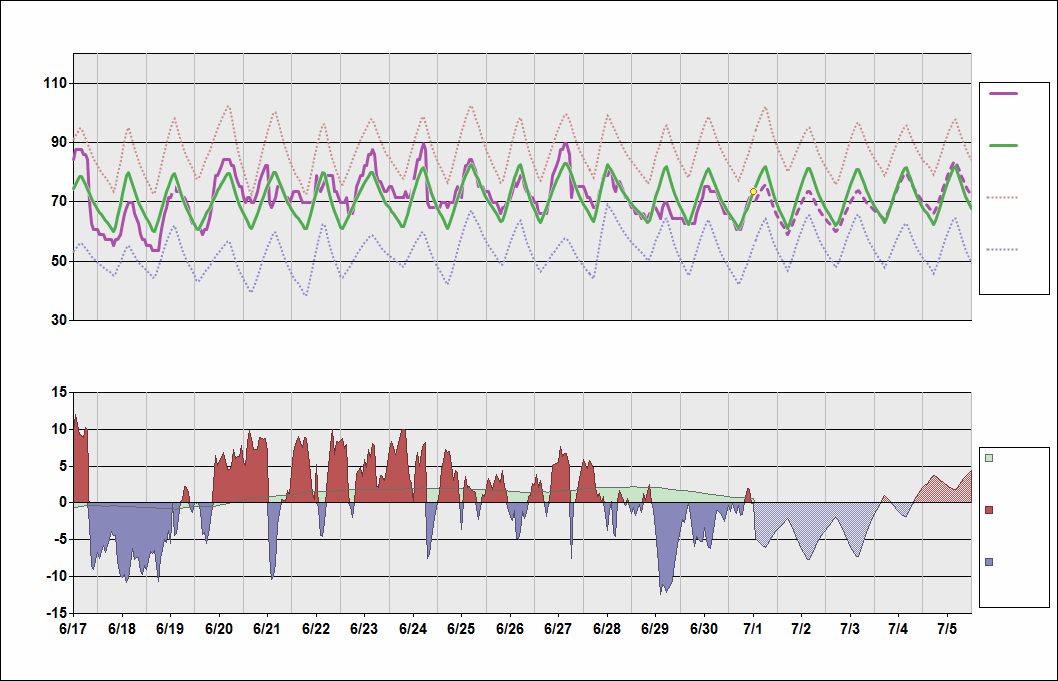
KORD Chart. • Daily Temperature Cycle


Chicago, Illinois (O'Hare)
Observed and Normal Temperatures
Temperature Deviations from Normal
Month/Day
Observed
Normal
Highest
Lowest
2-Week average
Above normal
Below normal
° Fahrenheit
° Fahrenheit
Airport Code
Temperatures
(Fahrenheit)
(Fahrenheit)
Observed
Normal
7/1: Recorded
High
High
Low
Deviation
2-Week
Deviation
Deviation
Date and Time
Year
Month
Day
Observation Time
Hour
:
Min