US Air Quality Gradebook
AirGrades
![]()
|
Under the fundamental issue of air quality, Creative Methods offers the US Air Quality Gradebook. Maps and gradesheets present a composite view of air quality for US counties. The concise presentations summarize ten Environmental Protection Agency (EPA) measures of ambient criteria air pollutant concentrations, and eleven EPA measures of pollutant emissions. They also show summary county grades based on the individual measurements. Most often one finds this information spread over many individual graphs and tables for the individual measures. The aim here is to first of all convert ambient concentrations or emission tonnages to five recognizable letter grades for air quality -- instead of raw parts per million concentrations or emission tonnages. Second is the desire to combine the measures into an overall letter grade for counties. The maps and gradesheets combine these two goals into a condensed format. [Graphics, navigation, and image-enlarging links are to the left, and short synopses of the topics on the right. Clicking a picture allows a quick, full-size example of a presentation for that topic. Use your browser’s “Back” arrow/button to return here. Clicking the blue underlined title or the “Go” button opens the topic. Return links and navigation bars at the bottoms of pages facilitate movement throughout the site.] |
Maps
|
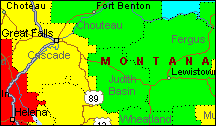
A good starting point is with the very visual and easily assimilated air quality maps. The maps color-code air quality grades A to F for US counties. For the maps -- as opposed to the gradesheets -- air quality in neighboring counties influences a county's map grade. |
Emission
Gradesheets
|
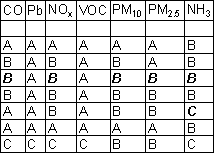
The emission gradesheets compare US counties for eleven air pollutant emissions. These include carbon monoxide, lead compounds, nitrogen oxides, volatile organic compounds, particulate matter (two sizes), ammonia, sulphur dioxide, hazardous air pollutants, diesel emissions, and acrolein. The grades are based on emission densities of pollutant tons per square mile. |
Ambient
Gradesheets
|
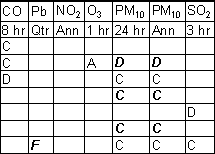
The ambient gradesheets reflect ten EPA standards for air pollutant concentrations. These concentration limits are for various sampling periods from 1 hour to annual, for six criteria air pollutants, namely carbon monoxide, lead, nitrogen dioxide, ozone, particulate matter, and sulphur dioxide. Grade F means exceeding the EPA standard. |
A
Molecular View
|
It may be surprising to non-scientists (and perhaps a fair reminder even for scientists) just how huge the number of air pollutant molecules are, even in air meeting EPA standards. The presentation shows that concentration reductions of a few percent have little meaning -- it is why chemists use a log scale for the concentrations reflected by the pH scale. We at Creative Methods reflect that people who are willing to pay a dollar a liter for bottled water seem to give little thought to poisons they inhale! |
Sources
|
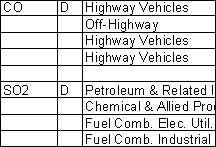
After ascertaining that a pollutant is an issue in a county, the next question is what its sources are. The sources topic lists important sources making up at least 80 percent of the county’s emissions for that pollutant. The results may be surprising and unexpected. Vehicle emissions are very dominant and may be much more important than the classic image of the polluting smokestack. Forest fires, wildfires and open burning are large contributors and may indicate a need for burning restrictions and much more aggressive firefighting relying more fully on modern mechanized equipment. |
|
We at Creative Methods hope US Air Quality Gradebook is helpful in giving you a clear, concise, and meaningful picture of US air quality. It’s all data. |
Return to Creative Methods Homepage
